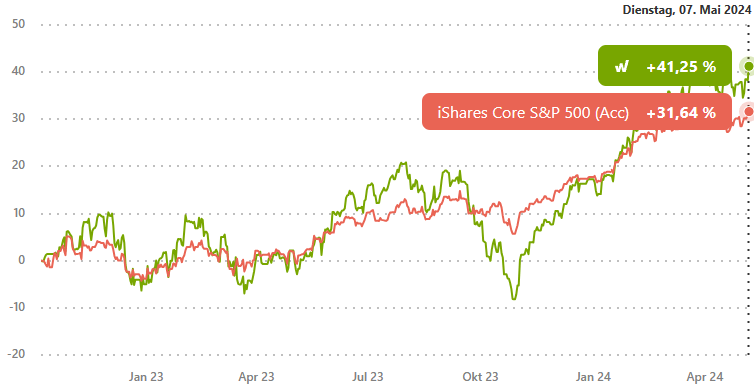
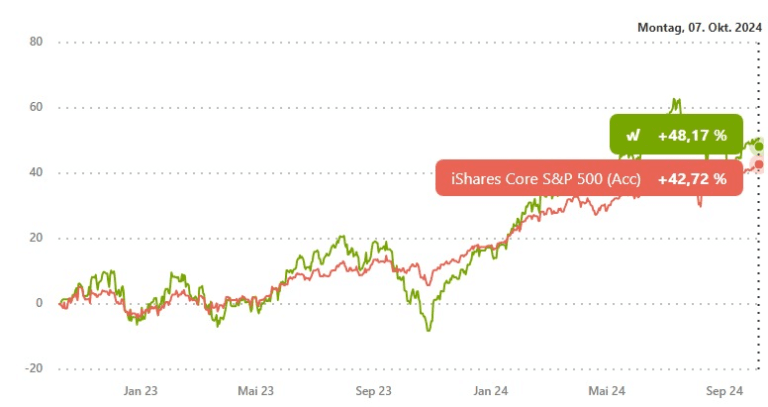
Mai 2024 Update zum wikifolio Relative Rendite US500
Charts

Portfoliokennzahlen
| Stichtag 07.05.2024 | Relative Rendite US500 | Benchmark |
| Performance seit Auflage | 41,25% | 31,64% |
| Relative Rendite | 1,07 | |
| Alpha | 0,02 | |
| Maximaler Verlust | -23,92% | -8,25% |
| CAGR | 23,84% | 18,55% |
| Volatilität | 23,75% | 12,59% |
| Sharpe Ratio | 0,84 | 1,16 |
| Sortino Ratio | 10,40 | 11,69 |
| Capture Ratio Up | 147,13 | |
| Capture Ratio Down | 124,09 | |
| Korrelation | 0,67 | |
| Beta | 1,24 | |
| Tracking Error | 18% | |
| Information Ratio | 30% | |
| Beste Woche | 10,22% | 4,60% |
| Schlechteste Woche | -6,47% | -4,29% |


