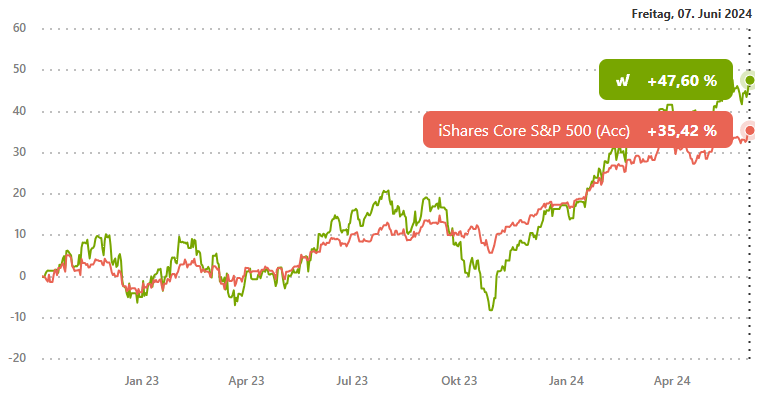
Juni 2024 Update zum wikifolio Relative Rendite US500
Charts

Portfoliokennzahlen
| Stichtag 07.06.2024 | Relative Rendite US500 | Benchmark |
| Wertentwicklung p.a. (CAGR) | 25,87% | 19,62% |
| Relative Rendite | 1,09 | |
| Volatilität | 23,55% | 12,38% |
| Maximaler Verlust | -23,92% | -8,25% |
| Maximale Verlustdauer | 4 Monate | 3 Monate |
| Sharpe Ratio | 0,93 | 1,26 |
| Sortino Ratio | 11,61 | 12,63 |
| Capture Ratio Up | 153,73 | |
| Capture Ratio Down | 126,51 | |
| Korrelation | 0,67 | |
| Beta | 1,26 | |
| Tracking Error | 17,69% | |
| Information Ratio | 35 | |
| Treynor Ratio | 18,83 | |
| Beste Woche | 10,22% | 4,60% |
| Schlechteste Woche | -6,47% | -4,29% |


