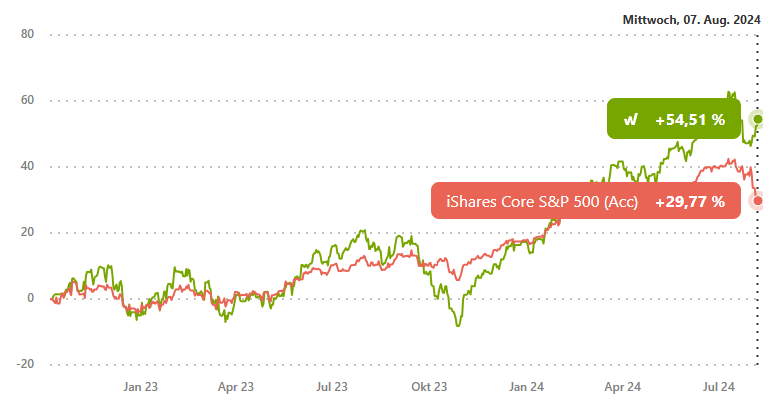
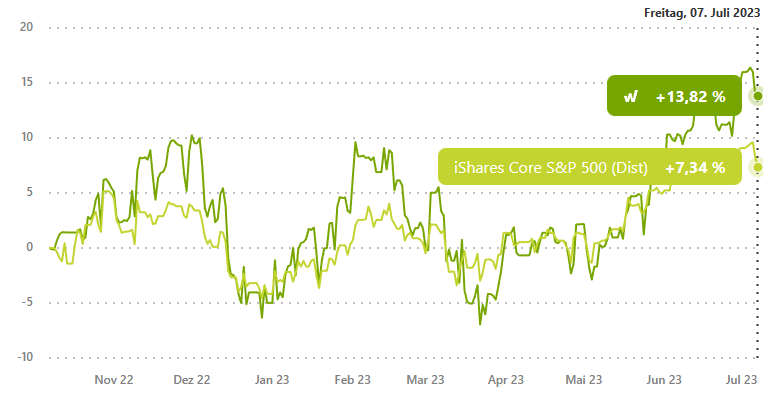
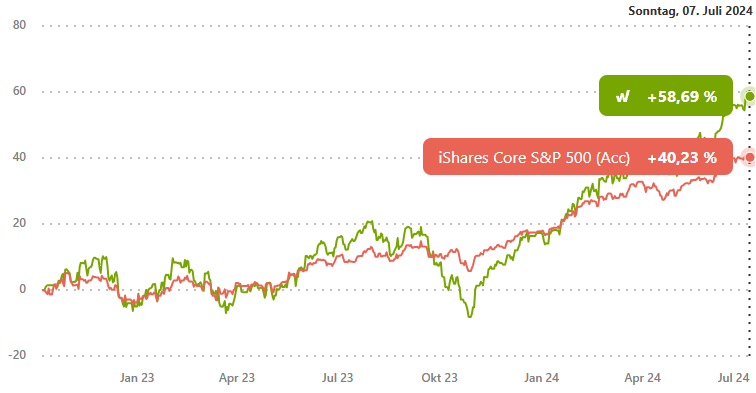
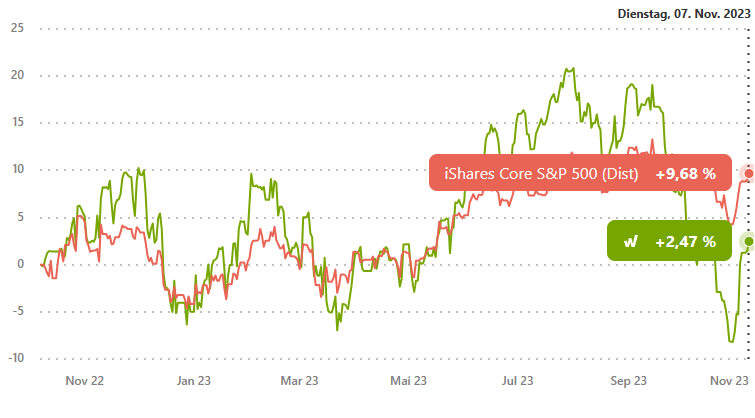
August 2024 Update zum wikifolio Relative Rendite US500
Charts

Portfoliokennzahlen
| Stichtag 07.08.2024 | Relative Rendite US500 | Benchmark |
|---|---|---|
| Wertentwicklung p.a. (CAGR) | 27,88% | 15,53% |
| Relative Rendite | 1,2 | |
| Volatilität | 24,90% | 12,82% |
| Maximaler Verlust | -24,04% | -8,95% |
| Max. konsekutive Verlustdauer | 171 Tage | 195 Tage |
| Sharpe Ratio | 0,96 | 0,90 |
| Capture Ratio Up | 124,58% | |
| Capture Ratio Down | 105,37% | |
| Korrelation | 0,54 | |
| Beta | 1,04 | |
| Tracking Error | 20,99% | |
| Information Ratio | 0,59 | |
| Treynor Ratio | 0,23 | |
| Calmar Ratio | 1,16 | 1,73 |
| Bester Tag | 5,67% | 2,80% |
| Schlechtester Tag | -4,59% | -3,74% |


